Flexible Logging With OpenTelemetry, Loki and Kafka
Originally published on the Meroxa blog.
Application logs are one of those things we often take for granted. Quietly humming along in the background until something goes wrong at 3 a.m., and suddenly, they're your best friend.
As more customers build and run applications on our platform, access to logs and visibility into what's happening under the hood has become one of our most frequent and important feature requests.
We've recently launched the feature to allow customers to view the logs from the applications they are creating, and in this post, I'll walk through the architecture we designed to make it all work using Conduit, OpenTelemetry Collector, Loki and Kafka.
High Level Architecture
As a quick overview, our platform enables users to build and deploy data pipeline applications that move data between various sources and destinations. The data movement is powered by our open-source Conduit solution. All this is running in Kubernetes.
Our goal was to collect and expose both lifecycle logs and Conduit application logs to our customers. In addition to logs, we also wanted to surface relevant metrics. With this observability data in place, we felt that users would be equipped to quickly diagnose common issues such as misconfigurations or malformed URLs, as well as detect more elusive problems, such as connectivity disruptions or unexpected failures.
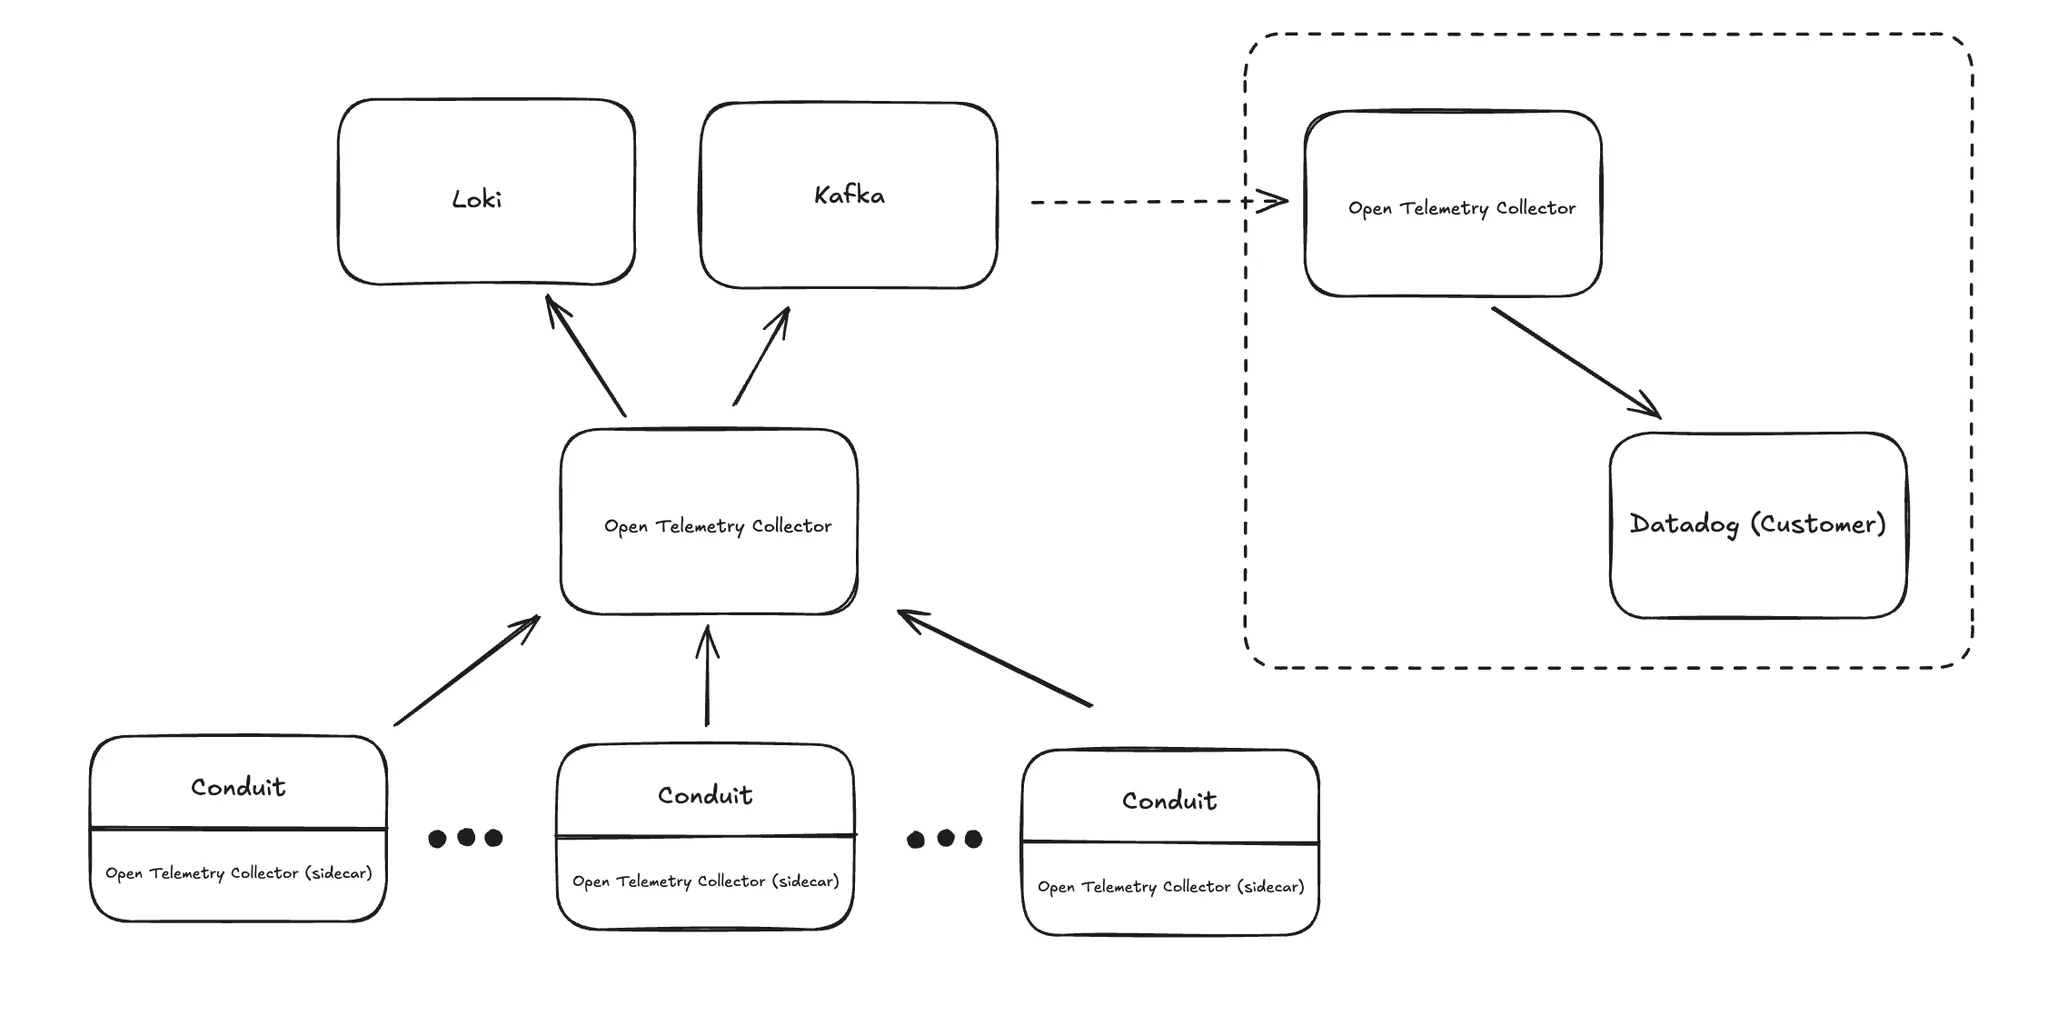
Here's a quick summary of the major components:
- Conduit (with sidecar collectors): Each Conduit instance runs with an OpenTelemetry Collector sidecar. These sidecars are responsible for capturing logs 'locally', close to where they're emitted, and forwarding them upstream.
- Central OpenTelemetry Collector: This component aggregates log data from all Conduit pods. It performs some basic processing and routing to downstream systems like Kafka and Loki.
- Loki: Used as our primary store for customer logs. We query the relevant data using its REST API and display it in our UI. As part of the Loki configuration we also control the retention period. We are fairly aggressive in pruning the logs as we've found that in our use cases logs lose their relevance quickly.
- Kafka: Serves as a transport layer for logs that need to be exported to customer-specific destinations.
- Customer-Facing Collector: A separate OpenTelemetry Collector consumes from Kafka and exports logs to external systems, such as Datadog, giving users access to their own application logs and metrics.
Except for Kafka, all this is on a per-tenant basis.
Open Telemetry All The Things

We've made use of the OpenTelemetry Collector because it gave us a lot of what we needed out of the box. Flexibility, a big ecosystem of extensions, and a clean way to decouple log collection from our application code. From sidecar collectors, to centralized processing, to exporting logs to external systems here's how we put it all together.
As you can see from the architecture, we've leaned heavily on the OpenTelemetry Collector.
Sidecar Logging
One of the key areas where we wanted to provide visibility was around the provisioning and operation of data pipelines running inside Conduit. These processes handle the actual data movement between sources and destinations, so observability here is critical.
In the Kubernetes world, the usual options for log collection are DaemonSets or sidecars. We initially explored using a DaemonSet, but ruled it out fairly quickly. Since we're running a multi-tenant setup, where Conduit pods from different customers can land on the same node, a DaemonSet would make it difficult to reliably separate and route logs per tenant.
With the sidecar approach, we get fine-grained control. By using the Kubernetes downward API along with the OpenTelemetry Collector's filelog receiver, we're able to pick up the right logs from the host and forward them to the appropriate downstream pipeline, all while preserving tenant isolation.
The OpenTelemetry Operator made this even easier. We just define the collector config and annotate our Conduit pods, and the operator takes care of injecting and managing the sidecars for us.
annotations:
  sidecar.opentelemetry.io/inject: "true"
Annotation on Conduit pod for sidecar management
Also, because a single customer application can involve multiple Conduit processes, we needed a way to consistently tie those logs back to the correct context. Here again, the downward API and the Collector's resource processor come in handy letting us attach the necessary metadata to each log record before it leaves the pod.
env:
  - name: POD_NAMESPACE
    valueFrom:
      fieldRef:
        fieldPath: metadata.namespace
...
receivers:
  filelog:
    include:
      - /var/log/pods/${env:POD_NAMESPACE}_${env:POD_NAME}_*/conduit-server/*.log
...
processors:
  resource:
    - action: insert
      key: app.id
      value: ${env:APP_ID}
...
exporters:
  otlp:
    endpoint: ${env:CENTRAL_COLLECTOR}
Configuration snippet for the Open Telemetry Collector running as the sidecar
Central Open Telemetry Collector
At the core is a central OpenTelemetry Collector instance. This acts as the main aggregation and processing point for all logs coming in from the sidecars. Besides routing the logs to the downstream systems, we also leverage the redaction processor to make sure sensitive data isn't stored or exported.
One of the biggest advantages of this setup is the clean decoupling it gives us. Sidecars focus only on local log capture and forwarding, while the central collector can evolve independently. Allowing us to adjust processing logic, add exporters, or even further adopt the gateway deployment pattern without touching tenant workloads.
env:
  - name: KAFKA_BOOTSTRAP_SERVERS
    valueFrom:
      secretKeyRef:
        name: {{ .Values.kafka.secret.name }}
        key: {{ .Values.kafka.secret.key }}
        optional: true
args:
  set: 'exporters.kafka.brokers=${env:KAFKA_BOOTSTRAP_SERVERS}'
...
exporters:
  otlphttp:
    endpoint: <loki-endpoint>
  kafka:
    topic: <topic-name>
...
processors:
  redaction:
    allow_all_keys: true
    blocked_values:
      - <regex>
      - <regex>
      - <regex>
Configuration snippet for our centralized Open Telemetry Collector
Customer Collector
It's become increasingly common for customers to bring their own observability stack, leveraging tools such as Datadog for logs and metrics. To support that, we have per-observability destination OpenTelemetry Collectors that consume logs from Kafka and forward them directly to the customer's observability system. With this approach logs from Conduit applications show up alongside the customer's existing data without having to adopt any additional tooling. Additionally, it helps keep things like API access keys isolated and scoped to this collector only.
Kafka played a key role in making this work. Each customer's downstream collector can independently consume their own logs from Kafka, giving us a nice way to route data per tenant.
That said, there were some real-world challenges. Because each customer has unique destinations and processing needs, we couldn't statically define exporters ahead of time. Kafka helped decouple things, but it also introduced some config complexity. The collector assumes a relatively static configuration, which doesn't mesh well with dynamic environments like ours. Built-in service discovery could go a long way in this regard. Finally, the Kafka receiver and exporter both require broker addresses in the config, but in our case, those are only known at deploy time. We worked around this by using command-line and environment variable overrides. This is workable, but not the smoothest experience.
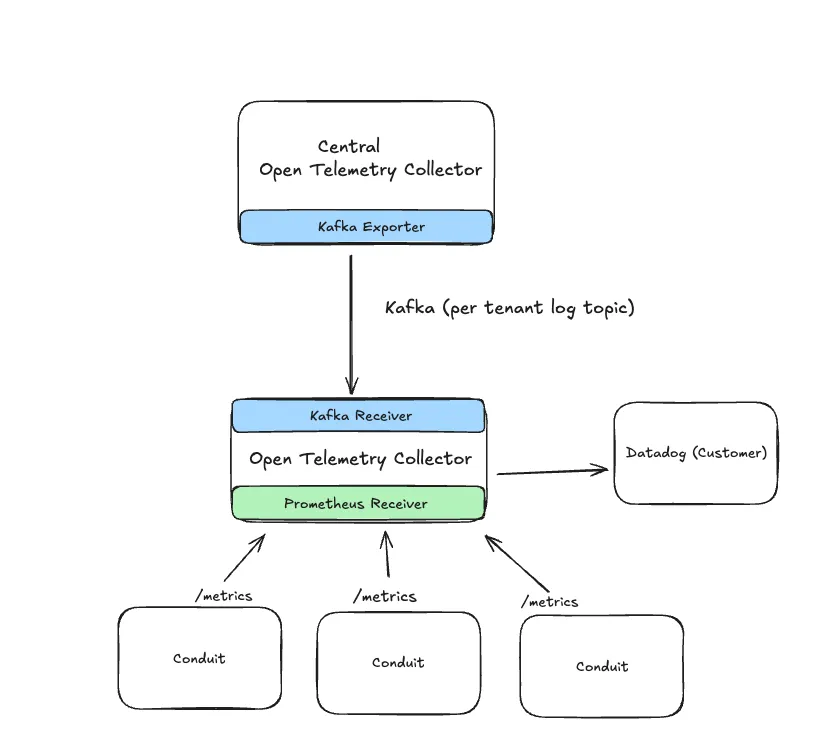
We also leverage the Prometheus receiver to collect metrics from our Conduit pods. Conduit provides a number of useful metrics that can be used to generate monitors and alerts. We can use the kubernetes_sd_configs to dynamically discover the Conduit pods for metrics collection. A future iteration could see this move to the centralized Collector or even down to the sidecar, but for now the current solution meets our needs.
env:
  - name: KAFKA_BOOTSTRAP_SERVERS
    valueFrom:
      secretKeyRef:
        name: {{ .Values.kafka.secret.name }}
        key: {{ .Values.kafka.secret.key }}
        optional: true
args:
  set: 'exporters.kafka.brokers=${env:KAFKA_BOOTSTRAP_SERVERS}'
...
receivers:
  kafka:
    topic: <topic-name>
  ...
  prometheus:
    kubernetes_sd_configs:
      - namespaces:
          names:
            - <namespace>
        role: pod
    relabel_configs:
      - action: keep
        regex: conduit-server.*
        source_labels:
          - __meta_kubernetes_pod_label_app_kubernetes_io_name
...
exporters:
  datadog:
    api:
      key: ${env:DD_API_KEY}
      site: ${env:DD_SITE}
Configuration snippet for our customer Collector
Conclusion
So far, this design has been working well for us. Customers can now access operational data both within our application and in their own Datadog instances. The feedback has been positive, with early indications showing that it's already helping teams debug issues much faster.